

Affordability "crisis," yet again

My faithful readers (reader?) know I am skeptical about there being an affordability “crisis” in the American new-car industry. Sure, prices are high, but demand is getting within hailing distance of our pre-pandemic 17 million run rate. Would we like to have a greater supply of cheaper cars? Sure, of course! (I’d like $45 Taylor Swift tickets, too!) But on the other hand, isn’t this just the market at work? Higher prices lower demand, lower prices raise it: is there a “crisis” in here somewhere? Especially as demand keeps inching upward.
Enter a Chart. The eminent dealership buy-sell advisor Alan Haig included in one of his recent Haig Reports a fascinating chart which I will swipe reproduce here. It shows how many weeks of pay the average American has to shell out for the average new car (at transaction price, not MSRP):
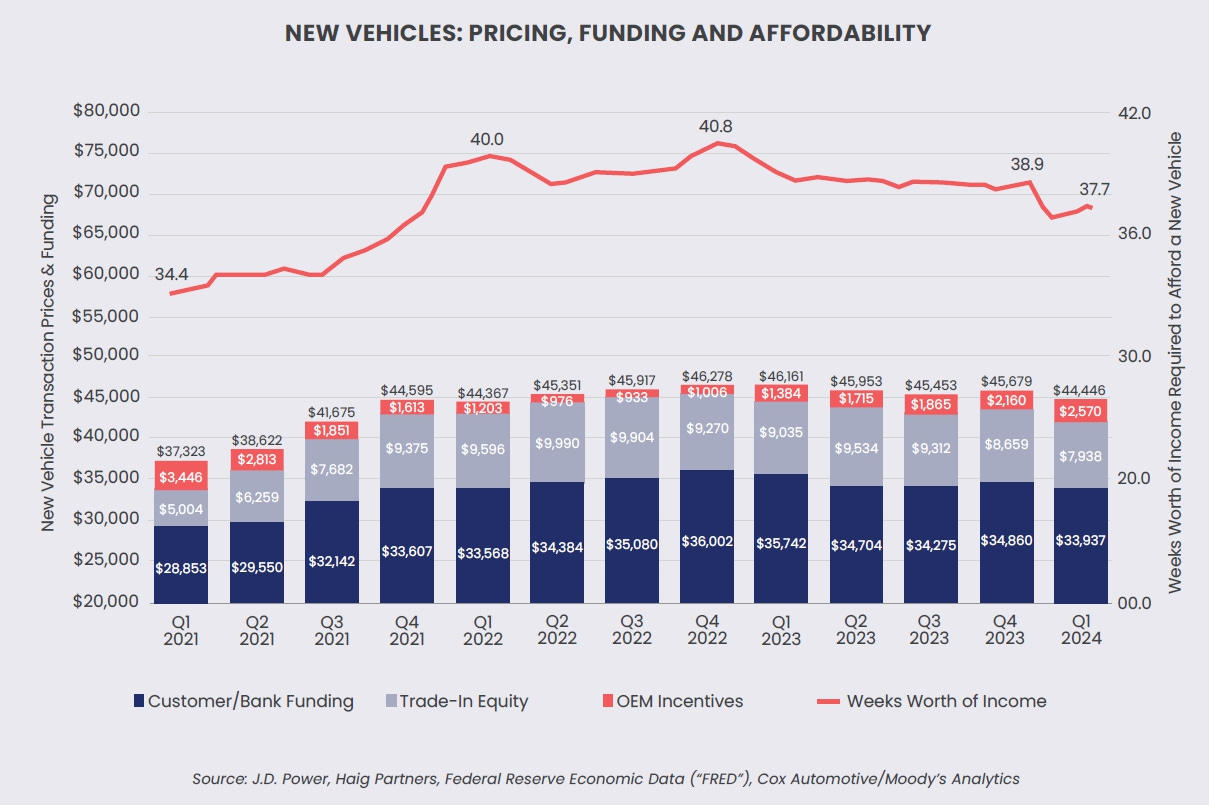
There are lots of moving parts here (e.g., fluctuating trade-in values) but the top line message is shown in… the top line. Is 37.7 weeks of pay higher than 34.4 weeks back in 2021? Yes. But it is lower than at almost any point in the last three years.
Frankly, I have been surprised by how robust demand has been throughout this period. Pre-pandemic estimates of price elasticity of demand would show sales today closer to 10 million than 16 million, at prices in the range of $45,000. But the market has held up very well (reinforcing my view that new cars are becoming a good purchased only by the relatively wealthy, with used cars becoming the vehicle of choice for the average American). I don’t see the crisis.
Now, 10 and a half million units moved in 2009: there was a crisis!
(Of course, given my track record in forecasting, you should probably all go and short OEM stocks right now!)1
No! (sigh): nothing in this post should be construed as investment advice!