

Counting Electrons Is Hard

It goes without saying (a phrase which always means “I’m going to say it anyway”) that there is a lot of debate about EVs. Are they good, bad, clean, dirty, sought after by customers or thrust upon us by our governments? There is no way this tiny blog is going to resolve those issues. But, in our own small world of Car Charts, we can point out that the EV debate is made harder to conduct by the reality that we can’t even agree on some of the most basic facts about EVs. Case in point: what share of USA (“light-duty” aka automobile) sales are BEV (battery electric vehicles, meaning excluding hybrids both plug-in and otherwise)? You’d think we could count total sales, divided by BEV sales, and have a good clean percentage? No. Here’s an illustration: two different data sources, both highly respected, seemingly counting the same thing, but coming up with different answers.

For once, I have removed source credits, in the spirit of trying to point out an issue, rather than of casting blame. (Especially since I know each source is doing its best to present accurate data.) But one can see any number of variations between these two data series. (And they are both very recently updated, so I am not comparing outdated with updated data points). You can see several individual monthly variations. But leaving those aside, the top chart says overall (to me, at least):
“We had a stumble at the start of 2023 but it’s been pretty much upward since,”
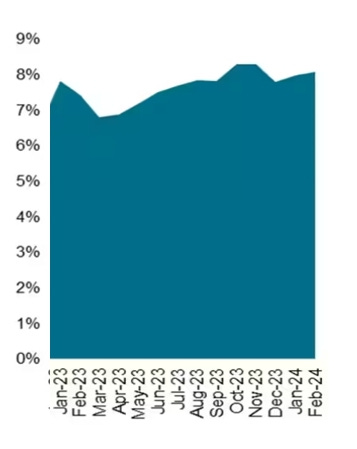
while the bottom chart says:
“It seems BEV share has at best plateaued, and at worst is now starting to fall.”
I show only two charts here because I wanted to use sources that included January and February 2024: if I eased that constraint and displayed sources that updated less rapidly (e.g. showed no months more recent than December 2023) I could include more pictures, but the result would be the same: disparate results.
I’m not sure what is going on here. We’ve already corrected for the “PHEV in or out?” issue: these are BEV numbers only. And any latency problems (e.g. February numbers may include estimates that are resolved later) don’t explain divergent numbers back in say, summer 2023. Maybe it’s “sales” versus “registrations” market shares? Sunspots?
On the one hand, what’s the big deal, why fret? We know the long-term trend for BEV market share is up, who cares if one source says month X is up and another says it is down? I can see the wisdom of that view, but on the other hand, OEM executives trying to decide whether to shift a few billion bucks from EV development to share buybacks, or politicians trying to decide whether to renew EV tax credits or not, all have to make decisions in real time with the info they have at hand — and the info we have at hand right now is not sending the clearest and most consistent signals.