

Miscellany 1

No theme today, just three Car Charts of possible interest.
First, now that we are safely past the UAW strike, an insight from the Chicago Fed, from their 2024 Automotive Insights Symposium, as presented by Kristin Dziczek. The talk about the strike was all about the level of wages and benefits, so a bit lost in the shuffle was any commentary on their flexibility. The auto industry has been plagued for decades with a high level of fixed costs, such that the urge to over-produce is strong (every incremental unit contributes at least something to fixed cost coverage), which as we know leads to destructive discounting.1 And indeed, around the year 2000 UAW labor at the Detroit 3 was essentially a fixed cost, thanks to all sorts of contract clauses that kept pay flowing almost regardless of volume produced.
But this has changed a great deal, and the chart below shows this. Prior to The Great Recession (TGR) workers demanded stable pay that did not fluctuate much with the booms and busts of the auto cycle. A fixed bonus of $10 might even be considered superior to a variable bonus of $12, if that $12 might fall to $3 next year. But the game changed with TGR, which triggered the two major bankruptcies and major government bailouts. Emerging from the wreckage were new UAW contracts which among other things traded off some fixed bonuses for variable profit-sharing payments. These soared, as the industry recovered. As the chart shows, profit-sharing before 2011 averaged less than $2,000 per head per year, but since then is running three times that or more.
And crucially, profit-sharing is variable: if the OEMs this year or further on take it on the chin due to price declines or cost overruns, profits will fall — and profit-sharing payouts will also fall. The cost structure has become somewhat more variable, and that means the pressure to go wild with discounts will be reduced, for the good of suppliers, OEMs, and dealers alike. We’ll see. But the point is, the structure of costs is almost as important as the level of costs.

While we’re talking about fluctuating profits, let’s move on now to some profits that almost never wildly fluctuate (so far, fingers crossed): those of American new-car dealerships. From a really excellent recent market outlook report produced jointly by Kaiser Associates and the Dave Cantin Group2, we have this chart of the gross, EBITDA, and net margin averages for the 6 or so publicly-traded dealer groups (e.g. Lithia), going back over 15 years. That is one flat line (or three), with of course the exception of the 2008/9 Carmageddon, where our sales run rate grazed perilously close to 10 million units.
The point I am trying to make with this chart is about the hedging that is innate in a modern new-car dealership. If new cars aren’t selling, maybe used cars are; if neither is selling well, service (parts and labor) is still in demand; and hey, cars are always colliding, so selling crash parts or running your own body shop will keep busy anyway. Thus, through thick and thin and despite the regular panic attacks I often cite (online disintermediation! OEM forward integration! CarMax!), the new-car dealership industry3 just hangs in there. I can imagine more than one OEM CEO who would give her or his right arm for this kind of stability (which is one reason so many OEMs seek subscription-type revenue, which in theory should be more stable over time than the boom-and-bust cycle of product launches and retirements).
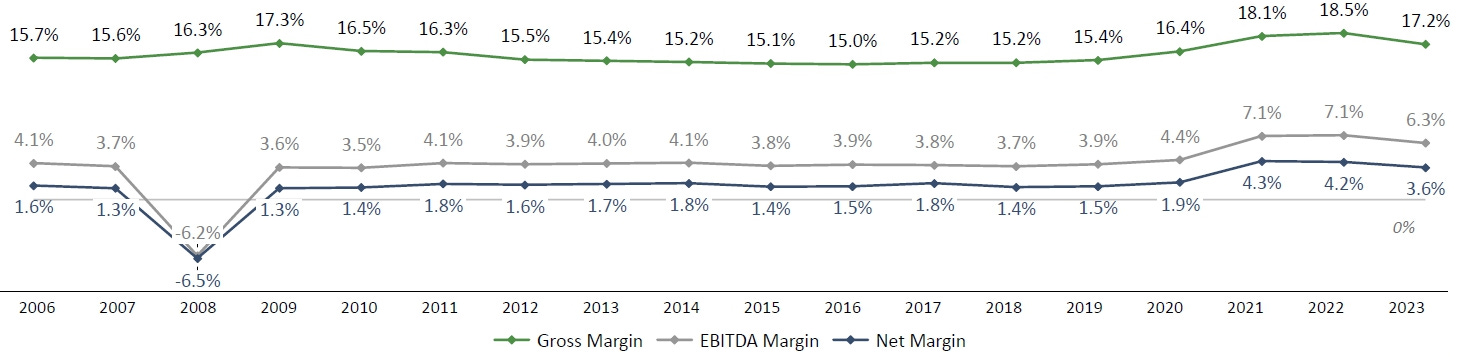
Source: Kaiser Associates and Dave Cantin Group
Just for grins, we’ll close with a photo and a quote, so it’s not really a car chart. Given all the news about Cruise and Waymo et al. recently, maybe we should remind ourselves just how long we’ve been working on autonomous driving:

See you soon with a few more miscellaneous car charts….
Put very succinctly, making one more unit contributes that one unit’s margin to fixed cost coverage, but selling that one more unit can require prices cuts that flow to all the units produced. We’ve discussed this before re Tesla’s pricing problems, but I remember first hearing the phenomenon mentioned in Detroit years ago as “the million-dollar Taurus,” the just one more unit that cost a million in losses.
Go here to take a look: davecantingroup.com/
My remarks apply only to new-car dealers. There is a different and equally fascinating story to be told about the so-called “independent” or used-car-only dealers, of which there are 60,000 in the USA. Or 40,000. Or over 100,000. These guys are really hard to count!