
One of Five
(Sorry, definitely NOT Seven of Nine)

The entire Car Charts team is in Las Vegas for the annual National Auto Dealer Association (NADA) show, and what a show it is! At least 20,000 attendees and at least 600 exhibitors and at least 4,375 mentions of “AI.” Probably. I’ll have to ask Claude.
In honor of the Show we’re going to try to issue 5 posts in 5 days, a feat of endurance (both writer’s and reader’s) matched only by things like this.
Let’s start off on a down note, and with luck finish on Friday with something more upbeat.
Last time I checked, market shares of companies in a given industry had to total to 100%1. And right now when it comes to car companies’ market shares, all the chatter - understandably - is about surging Chinese market shares around the world. But for someone to go up in market share, someone must go down, and here is a very sobering chart demonstrating that, especially if you are an American citizen.2
This is the global market share of the D3 (Detroit 3: GM, Ford, Stellantis3) combined, as prepared by the ace analysts at Alliance Bernstein SG, using IHS data. As always, one can debate how the numbers were sliced and diced (e.g., is a pickup truck counted as a commercial vehicle in one market and as a personal vehicle - aka “car” - in another?), but the chart’s message is very clear. From a combined 29% global market share in 2000 to 13% now. Simple extrapolation - which we can only hope will not come about - says the domestic American industry is entirely gone before 2050.
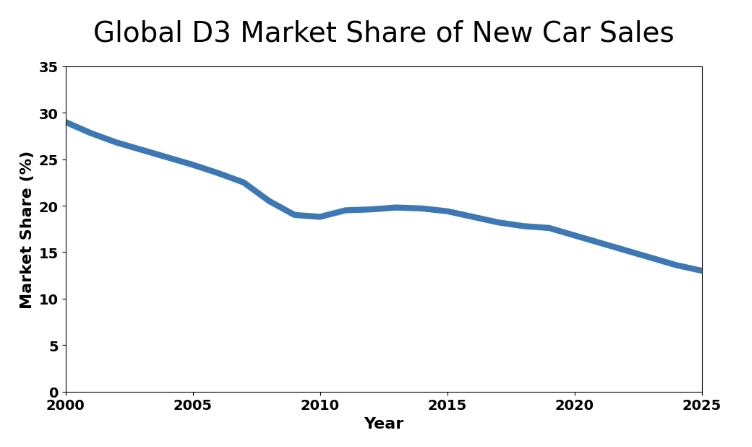
The absolute and relative pace of the decline varies by region of course, and the home market remains a somewhat safer haven - but only just. The 2000 and 2025 numbers for just the USA are 66% and 37%.
We can argue on and on about if the Chinese can be stopped, if Detroit should have stayed the course with EVs, if tariffs can stem the decline, etc.
However, at present the Detroit 3 are on course to become niche manufacturers on the global stage: making most of their volume and all of their profit on “cars” that are actually almost entirely pickup trucks and SUVs. This may be a profitable future for them, it might even be defensible4 , and maybe makes sense for the shareholders. But for this writer at least, this is one of the saddest automotive stories ever told.
We’ll lighten it up a bit tomorrow, promise.
ADDENDUM: As one of my bright readers (they are all bright readers, of course!) pointed out, this chart would look very different if phrased in revenue terms rather than unit terms, given very high prices in the USA, especially for full-size pickup trucks (currently at $65,000 or so). To make the point more clearly, using China as an example, Chinese unit sales are roughly twice USA unit sales, but at a price point roughly half that of America’s. So China is twice the size in unit terms, but equivalent in revenue terms… which in the end is what matters more.
My MBA really comes in handy for things like this.
If I were braver I’d insert here some kind of political joke about “birthright” versus other kinds of citizenship, but I’ll let you do that.
Its non-European brands only, I believe.
Do I have to remind you all yet again that the 25% tariff on imported pickup trucks in the USA has remained on the books, through boom and bust, Republican and Democratic Presidents, war and peace, since 1963?