

Holiday Chart #5

(Warning: extreme economics nerdiness follows! This is not an exciting post!)
“Elasticity of demand” is a measure of how the demand for a product or service changes in response to changes in selected economic variables.
Take the price elasticity of demand. There are products for which demand is inelastic relative to price. Like salt: even if I cut its price in half, you probably won’t buy more than you already intended. There are products for which demand is elastic. Popular soft drinks often fall into this category: if I cut the price of Mountain Dew in half, experience shows demand is likely to surge.
Not all elasticities relate to price: there is also income elasticity of demand. For some goods, demand hardly changes if you earn more (take salt again), while for others it can soar. Air travel falls into this category: double my pay and I may take many more trips in a year.
Economists spend a lot of time and effort trying to estimate price and income elasticities of demand. Estimating them for cars is very difficult, because the products are so complex. For example, demand for sports cars (which are not necessities) tends to be more elastic than demand for a family sedan1 (which is virtually an unavoidable necessity for the average American family). But demand for new cars generally should be somewhat elastic: if the price goes up, you can shift to a used car, or just keep your current car running longer.
But in recent years some observers have been baffled by what seem like inexplicable changes in the elasticity of demand for new cars. In 2019 we sold some 17 million units, at an average price of about $35,000. Typical price elasticity estimates back then were about 1.3. Thus we’d expect if price were to rise to $45,000 (close enough to where we are today), that would be an increase of about 30%, demand should fall by 1.3 times that, say 40%, and we’d be selling 10 million units. Instead, we’re shipping over 15 million!
What happened? There are lots of theories (the release of pent-up savings during the pandemic, for example), and they are probably all more or less true. But this post is going to eventually get to just ONE chart, and so I will focus on just ONE theory.
It is generally referred to as “the wealth effect.” That is, we can assert there is a third kind of elasticity, which is how demand responds to changes not in price or income, but in wealth. And since American wealth has sharply grown in recent years, that should make people much more willing to spend large sums on cars, even if price or income effects are moving in the other direction (via higher car prices, and inflation eating away at any wage increases).
Wealth elasticities of demand are hardly studied at all, relative to the other two types. But recent work by the fine people at the Reserve Bank of Australia2 has shown some surprising results which I believe validate the wealth effect theory, for cars at least. Here, finally, is the key chart:
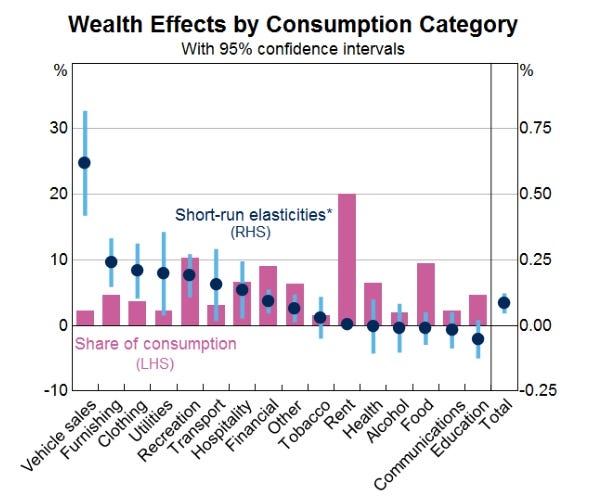
There’s a lot going on here, so read the paper for the full story, but focus for now on vehicle sales and the right axis, where the point estimate reads 0.6. Meaning, simplistically, a 10% increase in wealth (in this case, housing wealth) triggers a 6% increase in car sales. This makes sense intuitively: if your house has appreciated 10% this year, from say $500,000 to $550,000, you may be feeling pretty comfortable about splashing out $45 large on new wheels. Maybe even take out a home equity loan for the purchase.
And so this wealth effect may explain why demand for new cars in the USA is so robust. Taking 2010 as a starting year, so we are clear of The Great Recession, and using data from the St. Louis Federal Reserve FRED service, we see median household income is up 50% (unadjusted for inflation), but two measures of wealth are up much, much more: housing 115%3 and the S&P 500 over 400%. As the two primary reservoirs of personal wealth in the USA are one’s house and one’s stock holdings, we can observe that wealth has soared even as income (and car prices) have advanced much more slowly. I won’t try to calculate the the scale of the effect, given computational issues far beyond me (e.g., how to weight the relative impacts of equities and real estate), but it seems to me to go a long way towards explaining why a $45,000 car is now “the new normal.”
In sum, money in the bank matters, maybe even more than the paycheck.
Dad Joke of the day: “When I was a kid. I wanted to play the guitar really badly. [ wait… ] And after years of hard work, practice and dedication, I can now play the guitar really badly.”
(By the way, I do have a source for these, um, “funny” bits. It will be revealed at the end of this series of posts, so you can give credit where it is due.)
For those unfamiliar with the concept, a “sedan” is what people drove before we all woke up one day and decided only pickup trucks, SUVs, and crossovers existed.
“Wealth and Consumption“ a paper by May, Nodari, and Rees, March 2019, here: https://rba.gov.au/publications/bulletin/2019/mar/pdf/wealth-and-consumption.pdf Yes, while living in the US I read research by Aussie bankers. What I do for you people!
Using the S&P/Case-Shiller US national Home Price Index