


Let’s assume two things are broadly true. First, over time, at varying rates in varying locations, we’re going to see more EVs ( = BEV + PHEV ) on the road. Second, at present, in most regions, the growth in the rate at which these vehicles are being sold is slowing. As a result, there is much uncertainty and debate as to where EV market share will stand over the coming years.
This blog of course has no answer to that question: it’s beyond my pay grade for sure. But, this being Car Charts, we’ll lob a chart into the debate, one you may not have seen before. This is on comparative patenting activity. Panle Jia Barwick (University of Wisconsin - Madison) and co-authors Kwon, Li, Wang, and Zahur have taken a deep dive into “triadic”1 patents related to EV and ICE (internal combustion engine) technology over the period 1980-2018. (The paper, Industrial Policies and Innovation: Evidence from the Global Automotive Industry, cuts off at 2018 because it sometimes takes years for patents to work their way into the three offices’ databases and then on to the internet.)
I’ll excerpt just one chart here, that compares the rate of triadic patented inventions dedicated to EVs versus those dedicated to ICEs. (Also on the chart are “general” patents, patents that apply to cars beyond the powertrain, regardless of powertrain choice, as in for brakes or suspensions. Note the different scales: general patents are always more numerous than those dedicated purely to EV or to ICE, which makes sense, given the vast complexity of the car above and beyond the powertrain.).
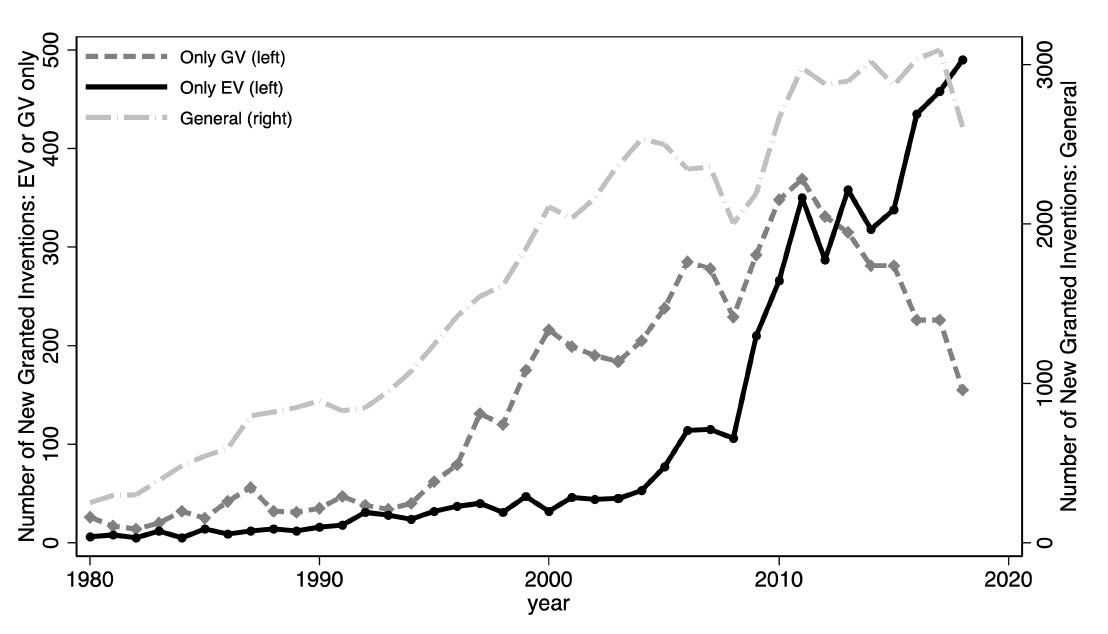
The point is simple and obvious, but it is good to have real data backing it up: car companies and their suppliers have been pouring R&D into EV technology at a rate much faster than that applying to ICE. The differential as of 2018 was about 3.5:1 in favor of EV, and I would guess has only widened since then.
Of course, one might expect ICE patent activity to be tailing off, as the technology is very mature, but on the other hand it was still growing as recently as 2010. So the diversion of effort into EV in my opinion reflects precisely that, a diversion of effort, not just an exhaustion of ICE technology progress.
What this means is that, however one views evolving consumer sentiment, or the rate at which chargers are installed, or which way a given government will jump, the OEMs and their suppliers have built up a real head of steam2 in terms of EV research. This means on the one hand that they will be expecting a return on this spending. And it also means, on the other hand, that even if markets continue to fluctuate, it will be very hard to redirect back to ICE tech the R&D centers that have focused for the last two decades on EV work.
It took quite a while for the EV industry to reach liftoff, but now that it has, returning to base seems improbable.
And now, a Bonus Chart! This same report includes a nice graph on government subsidies for EVs, in total and per car sold. Note that it includes only federal (national-level) incentives, not state (or province, etc.) or local (e.g. city) subsidies, such as a California or a Stuttgart might deploy.
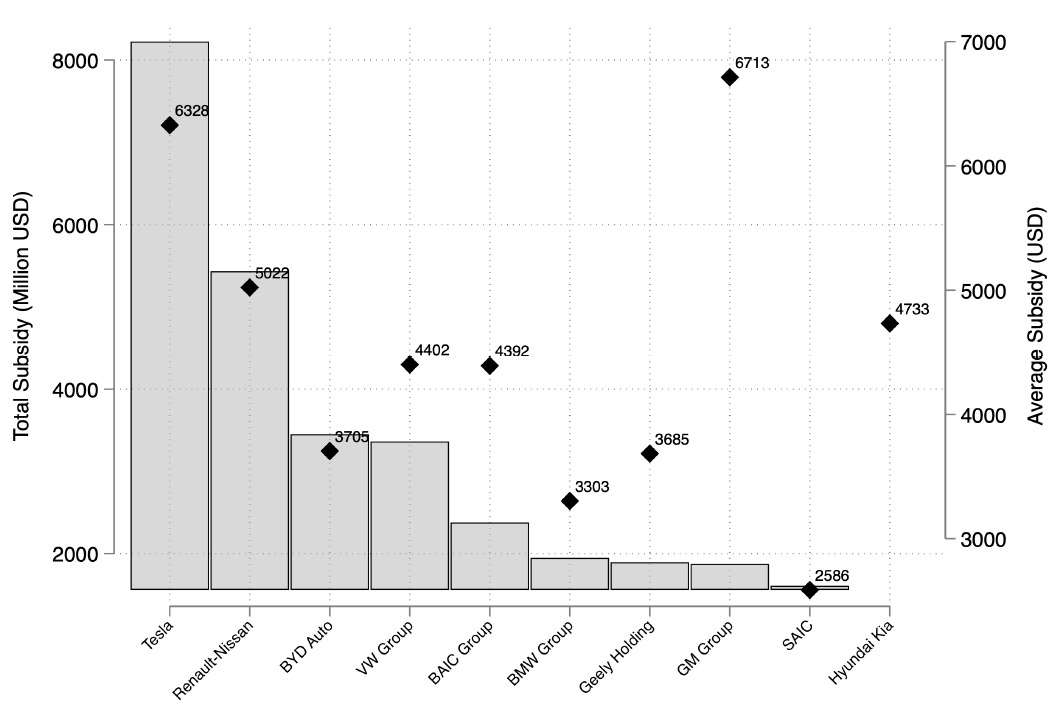
On the right axis we can see the authors calculate that General Motors EVs, for example, have benefited from about $6,700 of subsidy per vehicle sold. And on the left axis we can see that Tesla has benefited from over $8 billion of subsidies in total. The authors focus here on consumer subsidies (direct payments to consumers who buy EVs, acquisition and ownership tax credits, income tax credits, and sales tax exemptions, etc.). The total subsidy tab would be much higher if state and local incentives were included, and if corporate subsidies such as payments to get car and battery plants built, were also in the mix3. So consider these numbers to be absolute lower bounds of what total subsidies might come to. My personal gut feel is that, all in, $12,000 per car (to date) is about right for the US and Europe (China is a more complex matter), but note that is my opinion, not that of these authors!
Patents that have been applied for not just in Japan, or in the USA, or in the EU, but in all three jurisdictions at once. By looking at only triadic patents the authors are raising the quality bar: as they write, “Triadic patents are considered to have higher quality as they involve higher filing costs and reflect the applicant’s view that the technology has broader applicability.” These patents are therefore much more likely to enter usage in the real world, and are likely not just “science projects.”
Okay, poor choice of metaphor!
If you want more industrial (not consumer) subsidy info on American companies, specifically Tesla, this amazing site has all the detail you might want!